Comparing a split from a 500 m test with one from a 30-minute row is the quickest way to set the wrong target, because a good pace depends on the distance. Judge any split against results over the same distance or time, using the public percentiles below.
A good rowing pace per 500 m is one that compares well with other results over the same distance. In Concept2’s public rankings for the 2026 season (May 2025 to April 2026), the middle 2,000 m result among 10,198 ranked rowers was 7:55.0, or 1:58.7 per 500 m; the 75th-percentile result was 7:19.3 (1:49.8) and the 25th 8:48.8 (2:12.2). Over 30 minutes the median was 6,919 m, a 2:10.0 split. These are rowers who chose to post a result, unverified entries included, so treat them as a reference group of active rowers, not the whole population.
This page puts those public percentiles for five distances in one place, shows how to turn any result into a 500 m split with Concept2’s formulas, and turns a split into the time needed for a challenge distance. It is written for people setting targets for an indoor rowing challenge or a team relay. The numbers come from Concept2’s own pages, read on October 7, 2026; nothing here is our own testing.
Quick specs
| Input or item | Typical value or source | Why it matters |
|---|---|---|
| Pace (split) | Time per 500 m shown on the monitor, such as 2:00.0 | The common unit for every comparison on this page |
| Split from a distance result | 500 × time ÷ distance (Concept2 pace calculator) | Turns a 1k, 2k or 5k time into a split |
| Split from a timed result | 500 × time ÷ metres rowed (same formula) | Turns a 30-minute distance into a split |
| Time for a target distance | Split × distance ÷ 500 (Concept2) | Plans how long a challenge distance takes |
| Watts from a split | 2.80 ÷ (split in seconds ÷ 500)³ (Concept2 watts calculator) | Shows how much more power a faster split needs |
| Median 2k, 2026 rankings | 7:55.0, a 1:58.7 split, 10,198 people (Concept2 Logbook) | A reference point for “good” over 2,000 m |
| Season covered | May 1, 2025 to April 30, 2026 (Concept2’s May–April season) | Rankings reset every May |
What counts as a good pace depends on the distance
The shorter the distance, the faster the split: the median 500 m result in Concept2’s 2026 rankings averaged 1:45.9 per 500 m, while the median 30-minute row averaged 2:10.0. A split is only “good” against results over the same distance, so find your distance in the table first, then compare.
Results by percentile, 2026 season:
| Event (people) | 90th | 75th | 50th | 25th |
|---|---|---|---|---|
| 500 m (5,466) | 1:28.9 | 1:36.3 | 1:45.9 | 1:58.8 |
| 1,000 m (7,204) | 3:16.8 | 3:31.7 | 3:52.2 | 4:21.9 |
| 2,000 m (10,198) | 6:50.8 | 7:19.3 | 7:55.0 | 8:48.8 |
| 5,000 m (10,825) | 18:38.8 | 19:39.7 | 21:06.3 | 22:58.9 |
| 30 min (6,935) | 7,806 m | 7,401 m | 6,919 m | 6,339 m |
The same results as average split per 500 m:
| Event | 90th | 75th | 50th | 25th |
|---|---|---|---|---|
| 500 m | 1:28.9 | 1:36.3 | 1:45.9 | 1:58.8 |
| 1,000 m | 1:38.4 | 1:45.8 | 1:56.1 | 2:10.9 |
| 2,000 m | 1:42.7 | 1:49.8 | 1:58.7 | 2:12.2 |
| 5,000 m | 1:51.8 | 1:57.9 | 2:06.6 | 2:17.8 |
| 30 min | 1:55.2 | 2:01.6 | 2:10.0 | 2:21.9 |
The first table shows times (metres for 30 minutes); the second shows the split per 500 m that Concept2 lists for each result. In Concept2’s percentile box the 90th-percentile result is the fastest of the four and the 25th the slowest; in the usual meaning of percentiles, a 75th-percentile result is faster than about three quarters of the ranked results. Each person keeps only their best ranked result per event, so each row counts people, not attempts. Ranking pieces must also be single continuous pieces started from a stopped flywheel, so an interval session such as the 2,000 m with short rests in week 1 of the beginner plan does not compare with these tables.

Common mistake: Judging a 30-minute split against 2k numbers. A 2:05 split is slower than the 2k median but faster than the 30-minute median, so the same split reads as below or above the middle depending on the table you use.
Takeaway: Compare your split only with the row for the distance or time you actually rowed.
How to convert any result to pace per 500 m
Divide the time by the distance and multiply by 500. Concept2’s pace calculator states the three related formulas: split = 500 × (time ÷ distance), time = split × (distance ÷ 500), and distance = (time ÷ split) × 500. Work in seconds, then turn the answer back into minutes and seconds.
| You have | Formula | Worked example |
|---|---|---|
| A distance and a time, such as a 2k test | Split = 500 × time ÷ distance | 7:00 for 2,000 m: 500 × 420 ÷ 2,000 = 105 s = 1:45.0 |
| A 1k time | Same formula | 4:00 for 1,000 m: 500 × 240 ÷ 1,000 = 120 s = 2:00.0 |
| Metres rowed in a fixed time | Split = 500 × time ÷ metres | 7,500 m in 30 minutes: 500 × 1,800 ÷ 7,500 = 120 s = 2:00.0 |
| A split and a target distance | Time = split × distance ÷ 500 | 2:00.0 for 5,000 m: 120 × 5,000 ÷ 500 = 1,200 s = 20:00.0 |
| A split and a fixed time | Distance = time ÷ split × 500 | 30 minutes at 2:30.0: 1,800 ÷ 150 × 500 = 6,000 m |
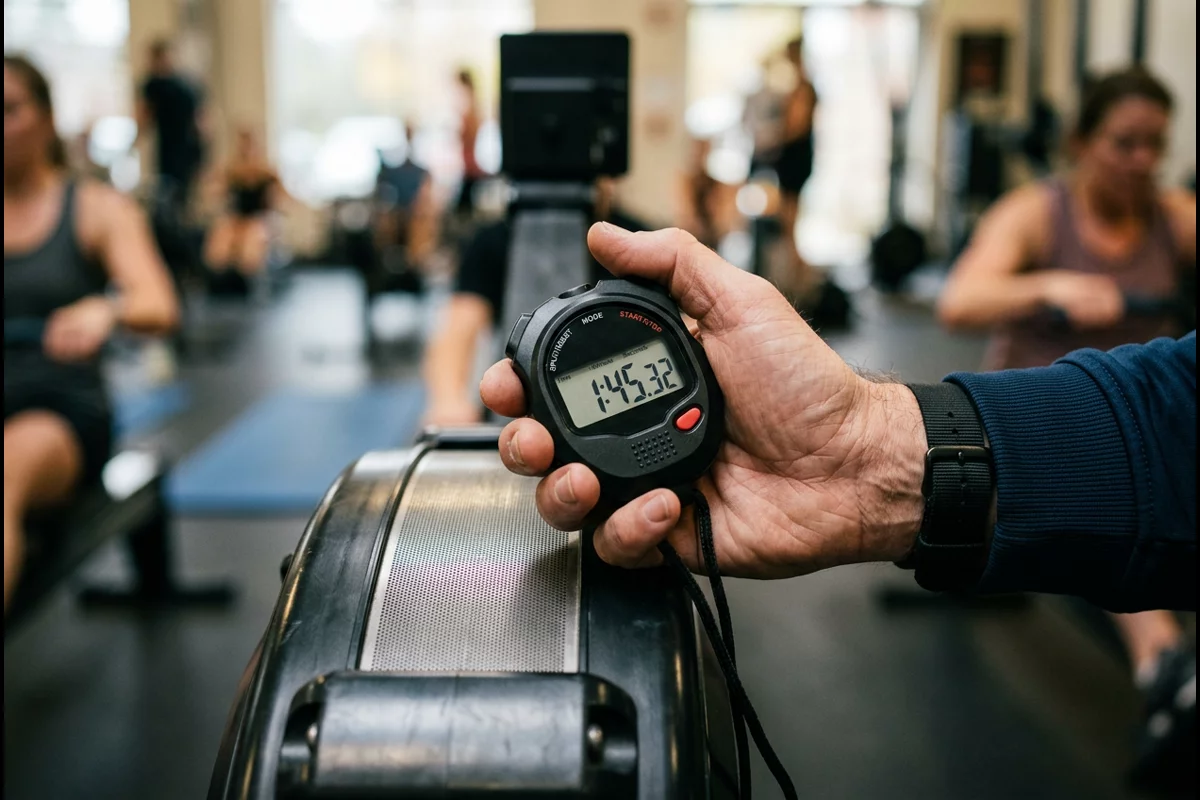
Concept2’s own example on the calculator page checks the method: 2,000 m at a 1:50 split gives 7:20. The monitor shows the same split live as you row, so you can compare a test result with your steady pace directly.
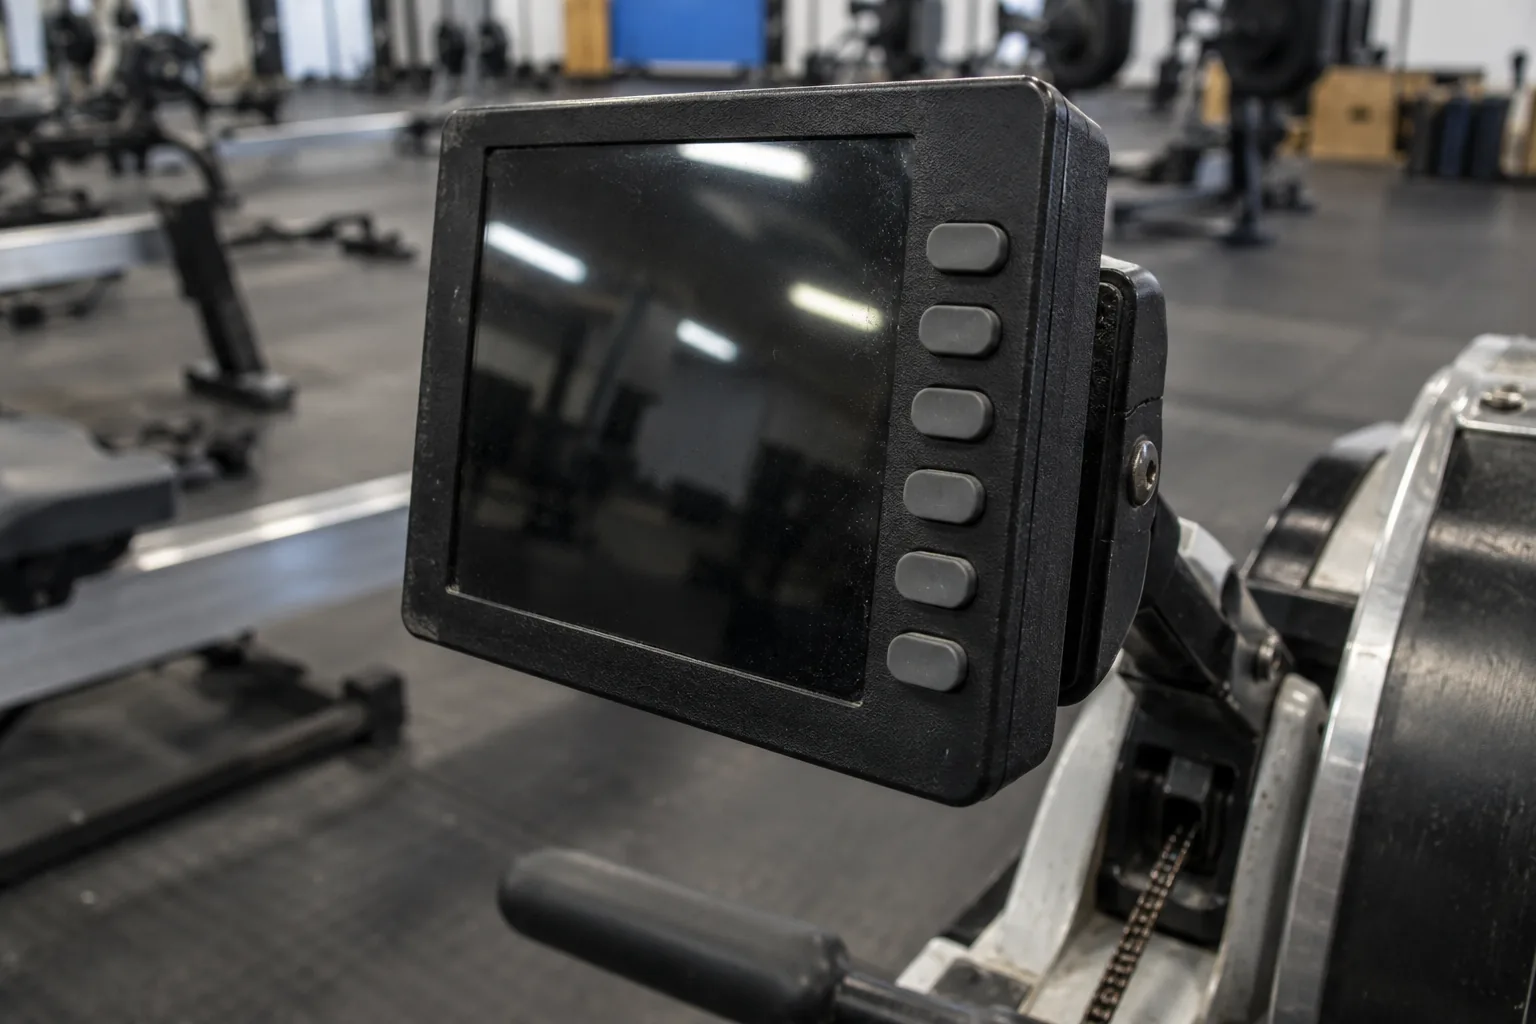
If you are new to the monitor, the beginner rowing workouts guide shows where the split appears on the screen and includes a first steady row whose pace you can use as your starting number.
Takeaway: Convert every result to seconds per 500 m before comparing it with anything.
2k benchmarks by sex and age
For the 2,000 m, Concept2’s rankings let you filter by sex and age, and the percentiles shift a lot between groups. The median ranked man in the 2026 season rowed 7:45.4 (1:56.3), the median ranked woman 8:50.7 (2:12.6), and medians slow with age in both groups.
| 2,000 m, 2026 season | People | 75th percentile | Median | 25th percentile |
|---|---|---|---|---|
| Men, all ages | 8,246 | 7:11.8 | 7:45.4 | 8:30.6 |
| Men 19–29 | 540 | 6:36.3 | 6:57.8 | 7:29.9 |
| Men 30–39 | 1,245 | 6:56.7 | 7:24.6 | 7:58.9 |
| Men 40–49 | 1,966 | 7:09.5 | 7:38.2 | 8:11.5 |
| Men 50–54 | 966 | 7:17.4 | 7:43.7 | 8:17.5 |
| Men 60–64 | 753 | 7:36.2 | 8:04.7 | 8:50.6 |
| Women, all ages | 1,952 | 8:05.5 | 8:50.7 | 9:46.5 |
| Women 19–29 | 214 | 7:37.4 | 8:01.7 | 8:39.1 |
| Women 30–39 | 271 | 7:51.8 | 8:27.9 | 9:26.3 |
| Women 40–49 | 405 | 8:01.9 | 8:38.0 | 9:28.0 |
| Women 50–54 | 203 | 8:08.8 | 8:56.2 | 9:38.9 |
| Women 60–64 | 188 | 8:40.8 | 9:14.9 | 10:19.0 |
All rows include both weight classes, all countries and unverified results, and exclude adaptive categories, matching the default view of the ranking page. The women’s age groups each hold fewer than 500 results, so use them as rough guides rather than precise cut-offs. Concept2 also offers other age bands, such as 55–59, on the same page.
Takeaway: Compare a 2k with your own sex and age row, and treat the small groups as rough guides.
What a faster split costs in watts
Each second off your split costs more power than the one before. Concept2’s watts calculator uses watts = 2.80 ÷ pace³, where pace is seconds per metre, so a 2:00 split is about 202.5 W and a 1:50 split about 263.0 W: roughly 30% more power for 10 seconds per 500 m.
| Split per 500 m | Watts (Concept2 formula) | Split per 500 m | Watts (Concept2 formula) |
|---|---|---|---|
| 1:40.0 | 350.0 | 2:05.0 | 179.2 |
| 1:45.0 | 302.3 | 2:10.0 | 159.3 |
| 1:50.0 | 263.0 | 2:20.0 | 127.6 |
| 1:55.0 | 230.1 | 2:30.0 | 103.7 |
| 2:00.0 | 202.5 | 2:40.0 | 85.4 |
Concept2’s worked example on the watts page matches the table: a 2:05 split is 125 seconds over 500 m, a pace of 0.25, and 2.80 ÷ 0.25³ = 179.2 W. The same formula runs in reverse, pace = ∛(2.80 ÷ watts), if your monitor is set to show watts. Stroke rate is a separate number: Concept2’s stroke-rate guide, summarised in the beginner guide’s effort section, notes that a higher rate brings a faster split only if technique and effort per stroke hold up. The order that keeps that work on the legs, then the trunk, then the arms is the subject of the indoor rowing form guide.

For a team setting targets, this curve is one reason to plan with splits each rower has actually held over a similar length of time: the power behind a fast split rises steeply.
Takeaway: Expect each step to a faster split to need a bigger jump in power than the last one.
Plan a challenge: time equals pace times distance
Multiply your steady split by the distance and divide by 500 to get the rowing time. A team or a single rower can use the table below to see how long common challenge distances take at six steady splits; times are rowing time only, without changeovers or breaks.
Faster splits:
| Distance | 1:50 | 2:00 | 2:10 |
|---|---|---|---|
| 2,000 m | 7:20 | 8:00 | 8:40 |
| 5,000 m | 18:20 | 20:00 | 21:40 |
| 10,000 m | 36:40 | 40:00 | 43:20 |
| Half marathon | 1:17:21 | 1:24:23 | 1:31:25 |
| Marathon | 2:34:43 | 2:48:47 | 3:02:51 |
| 100,000 m | 6:06:40 | 6:40:00 | 7:13:20 |
| 1,000,000 m | 61:06:40 | 66:40:00 | 72:13:20 |
Slower splits:
| Distance | 2:20 | 2:30 | 2:40 |
|---|---|---|---|
| 2,000 m | 9:20 | 10:00 | 10:40 |
| 5,000 m | 23:20 | 25:00 | 26:40 |
| 10,000 m | 46:40 | 50:00 | 53:20 |
| Half marathon | 1:38:27 | 1:45:29 | 1:52:31 |
| Marathon | 3:16:55 | 3:30:59 | 3:45:02 |
| 100,000 m | 7:46:40 | 8:20:00 | 8:53:20 |
| 1,000,000 m | 77:46:40 | 83:20:00 | 88:53:20 |
The half marathon is 21,097 m and the marathon 42,195 m.
Worked example, with assumed inputs: a team plans a 100,000 m relay and expects its rowers to average 2:20 per 500 m. Rowing time is 140 × 100,000 ÷ 500 = 28,000 seconds, or 7:46:40. With 20-minute shifts, each shift covers 1,200 ÷ 140 × 500 ≈ 4,286 m, so the relay takes 23 full shifts plus a final shift of 6:40 (28,000 − 23 × 1,200 = 400 seconds); eight rowers would take three shifts each, with the last one short. Changeovers add time on top, which the charity challenge event plan covers along with rotas and counting metres; the wider volunteer and logistics questions sit in the event planning guides.

Use each rower’s actual average split from a recent row of similar length to the shift, such as 20 or 30 minutes, and do not assume a 2k test split holds for a whole shift. New rowers can get that number from a steady row in the 4-week beginner plan. If donations are collected at the venue, the explainer on contactless donations at events covers how card readers handle taps.
Common mistake: Planning shifts from each rower’s best 2k split. A 2k test is a different event from a 20-minute shift, and the rankings list them separately; plan with each rower’s recent average over a similar length and add time for changeovers.
More on pacing long efforts, alone or as a team, is collected under endurance challenges.
Takeaway: Plan with steady splits, then add changeover time before fixing the schedule.
When this does not apply
The percentiles describe one group, Concept2 rankers in the non-adaptive 2026 lists, and do not apply to other machines, water rowing or individual training targets. The time, distance and split formulas are plain arithmetic for any result you enter; the watts formula is Concept2’s model for its monitors. Check these limits before relying on the numbers:
- Self-selected rankers. The rankings show people who chose to post a result, unverified results included by default, adaptive categories excluded, with one best result per person and event. They describe active rowers who log results, not the general population.
- Concept2 machines only. Concept2 accepts logbook and ranking data only from its own equipment. Results from other brands’ monitors are not part of these rankings, so the table says nothing about how they compare.
- Season boundaries. Rankings run from May 1 to April 30; a new season starts empty each May, so early-season numbers rest on fewer results. This page uses the completed 2026 season.
- Rowing on water. Boat speed depends on the boat, crew and conditions; none of these figures apply on the water.
- Training advice. The page compares results and plans time; it does not set training zones or effort targets for individuals. The about page explains what this independent site does and does not cover.
Takeaway: Treat the percentiles as a reference group of active Concept2 users, the conversions as arithmetic, and the watts model as Concept2’s own.
Method and sources
We read Concept2’s public ranking pages for the 2026 RowErg season on October 7, 2026, using the default filters (all weights, all countries, unverified results included, adaptive: no) and the sex and age filters for the 2,000 m table; the percentile values are the ones Concept2 displays, not our own calculation. Splits in brackets are the ones Concept2 shows next to each result. The formulas come from Concept2’s pace and watts calculator pages; all worked examples and the planning table were calculated with those formulas, and the relay example uses assumed inputs. Ranking pages can change if results are removed, so check the live pages for the latest figures. The cover image is an illustration. More guides on long efforts are in endurance challenges, and machine basics are in indoor rowing.
Takeaway: Before reusing a figure from this page, check the season, the filters and the live ranking page it came from.
Related reading
- Indoor rowing form: the catch, drive, finish and recovery order behind a split you can compare.
- Rowing machine workouts for beginners: build up to the steady row that gives you a planning split.
- How to organize a charity challenge event: turn the time from the planning table into shifts, roles and a schedule.
- Event planning guides: more on organising a team challenge.