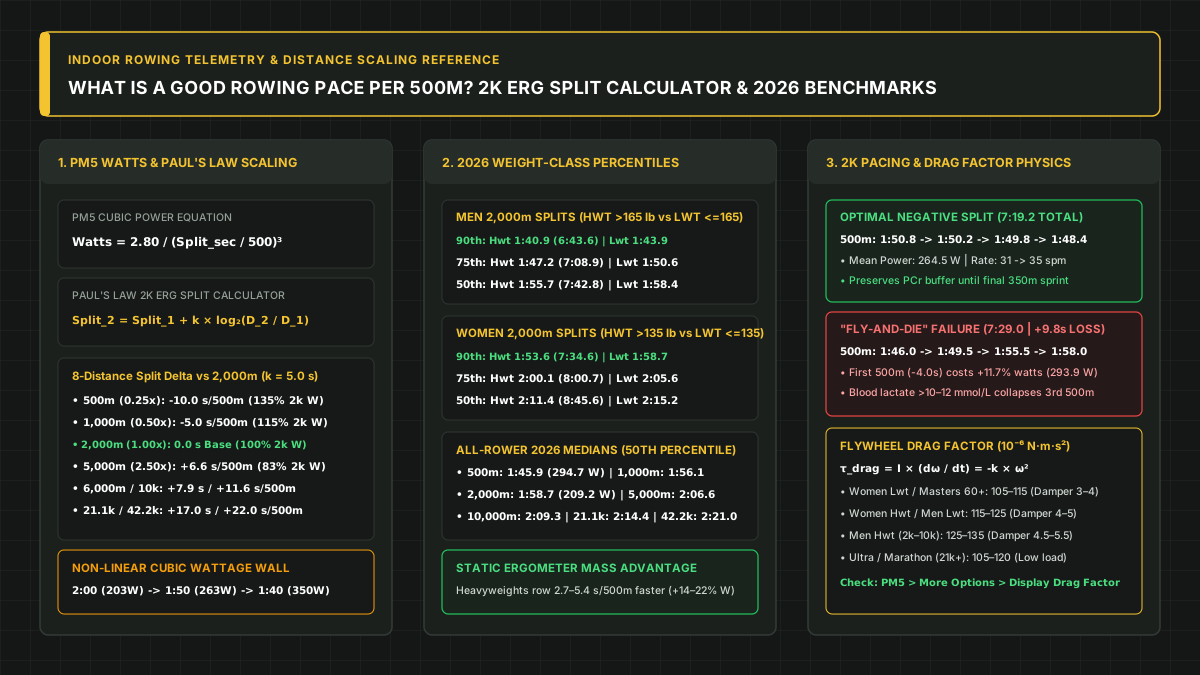
Judging a 5,000m or 10,000m piece against a 2,000m split—or comparing a lightweight rower against an open heavyweight leaderboard—sets the wrong target and causes costly mid-piece pacing failures. Determining what is a good rowing pace per 500m requires anchoring every split to three variables: event distance (500m sprint to 42,195m marathon), sex and official Concept2 weight class (Heavyweight vs Lightweight), and the cubic power curve (Watts = 2.80 / (Split_sec / 500)³). In Concept2’s 2026 Season World Rankings (May 1, 2025 – April 30, 2026), the overall 50th-percentile (median) pace across 10,198 ranked 2,000m rowers is 1:58.7 /500m (7:55.0, 209.2 W), with the 75th percentile at 1:49.8 /500m (7:19.3, 264.4 W) and the 90th percentile at 1:42.7 /500m (6:50.8, 323.1 W). Across all eight standard distances, the 2026 median slows logarithmically from 1:45.9 (500m) and 1:56.1 (1,000m) to 1:58.7 (2,000m), 2:06.6 (5,000m), 2:07.5 (6,000m), 2:09.3 (10,000m), 2:14.4 (21,097m Half Marathon), and 2:21.0 /500m (42,195m Full Marathon).
While our supporting pillar on the rowing pace per 500m chart and conversion formulas covers linear time-to-distance arithmetic (Split = 500 × Time / Distance) and fixed-split 100,000m to 1,000,000m relay tables, this guide provides the logarithmic distance-scaling engine (2k erg split calculator), weight-class percentile disaggregation, and physiological pacing mechanics required for any single distance.
Quick telemetry & benchmark specifications
| Parameter | Formula or 2026 Concept2 benchmark | Source | Operational application |
|---|---|---|---|
| PM5 Mechanical Power | Watts = 2.80 / (Split_sec / 500)³ |
Concept2 Watts Calculator | Converts split to watts (2:00.0 = 202.5 W; 1:45.0 = 302.3 W) |
| Reverse Split from Watts | Split_sec = 500 × (2.80 / Watts)^(1/3) |
Concept2 Watts Calculator | Finds exact /500m split for a target power ceiling |
Paul’s Law (2k erg split calculator) |
Split_2 = Split_1 + k × log₂(D_2 / D_1) |
Standard k = 5.0 s per doubling |
Scales 2k split to 500m (-10.0s), 5k (+6.6s), 10k (+11.6s), 42.2k (+22.0s) |
Overall 2,000m Percentiles |
90th: 1:42.7 | 75th: 1:49.8 | 50th: 1:58.7 | 25th: 2:12.2 |
2026 2000m Rankings (n = 10,198) |
Baseline across all non-adaptive 2,000m RowErg entries |
Men 2,000m Median by Weight |
Hwt (>165 lb): 1:55.7 (7:42.8) | Lwt (<=165 lb): 1:58.4 (7:53.7) |
Individual Rules & Logbook | Heavyweight men average 2.7 s/500m (+7.2% W) faster at the median |
Women 2,000m Median by Weight |
Hwt (>135 lb): 2:11.4 (8:45.6) | Lwt (<=135 lb): 2:15.2 (9:00.9) |
Individual Rules & Logbook | Heavyweight women average 3.8 s/500m (+8.9% W) faster at the median |
Flywheel Drag Factor (k) |
τ_drag = I × (dω / dt) = -k × ω² (105–135 in 10⁻⁶ N·m·s²) |
Damper & Drag Factor Guide | Checked via PM5 > More Options > Display Drag Factor (I ≈ 0.1001 kg·m²) |
Stroke-Rate Bands (spm) |
500m: 36–44+ | 2k: 28–34 | 5k–6k: 24–27 | 10k+: 18–24 spm |
Stroke Rate Explained | Matches stroke turnover to aerobic vs anaerobic energy demand |
1. Concept2 PM5 Cubic Power Physics and the Paul’s Law 2k Erg Split Calculator
Understanding what is a good rowing pace per 500m across distances starts with the telemetry inside the Concept2 Performance Monitor (PM3, PM4, and PM5). Because the RowErg uses an air-braked fan flywheel, aerodynamic drag torque scales with the square of angular velocity (τ_drag = k × ω²), and mechanical power (P = τ_drag × ω) scales with the cube of velocity (P ∝ v³).
The Aerodynamic Cubic Power Equation (Watts = 2.80 / pace³)
When you pull the handle during the drive, the chain accelerates the fan blades against air inside the perforated cage. Defining pace (seconds per meter) as Split_500m_seconds / 500, Concept2’s official Watts Calculator converts between /500m split time and mechanical power using a dimensionless constant of 2.80:
Pace (seconds per meter) = Split_500m_seconds / 500

Watts = 2.80 / (Pace)³ = 2.80 / (Split_500m_seconds / 500)³ = (3.50 × 10⁸) / (Split_500m_seconds)³

Split_500m_seconds = 500 × (2.80 / Watts)^(1/3)

Watts_Ratio (W_2 / W_1) = (Split_1 / Split_2)³
Because mechanical wattage scales inversely with the cube of split time, shaving a fixed 10.0 seconds per 500m demands an accelerating, non-linear jump in power:
2:30.0(150 s) to2:20.0(140 s):103.7 Wto127.6 W(+23.9 Wor+23.0%).2:00.0(120 s) to1:50.0(110 s):202.5 Wto263.0 W(+60.5 Wor+29.9%).1:40.0(100 s) to1:30.0(90 s):350.0 Wto480.1 W(+130.1 Wor+37.2%above350.0 W, and2.37xthe wattage of2:00.0).1:30.0(90 s) to1:20.0(80 s):480.1 Wto683.6 W(+203.5 Wor+42.4%).
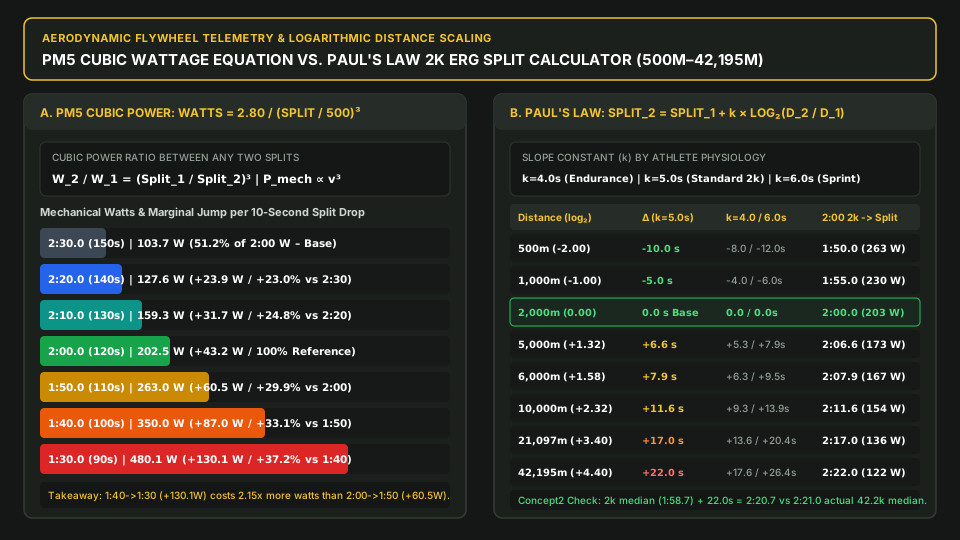
Split per 500m (Pace) |
Mechanical Watts | Marginal Jump & 2:00 Ratio |
Benchmark Context |
|---|---|---|---|
2:30.0 (0.300 s/m) |
103.7 W |
Baseline (51.2% of 2:00 W) |
Warm-up, recovery, or 42,195m 25th percentile |
2:20.0 (0.280 s/m) |
127.6 W |
+23.9 W (+23.0% | 63.0% of 2:00 W) |
Full Marathon (42,195m) 2026 median (2:21.0) |
2:10.0 (0.260 s/m) |
159.3 W |
+31.7 W (+24.8% | 78.7% of 2:00 W) |
10,000m (2:09.3) & 30-min (2:10.0) median |
2:00.0 (0.240 s/m) |
202.5 W |
+43.2 W (+27.1% | 100.0% Ref) |
Sub-8:00 2,000m (8:00.0); near 2k median (1:58.7) |
1:55.0 (0.230 s/m) |
230.1 W |
+27.6 W (+13.6% | 113.6% of 2:00 W) |
Men Hwt 2,000m median (1:55.7) & Men 10k 90th (1:54.6) |
1:50.0 (0.220 s/m) |
263.0 W |
+60.5 W (+29.9% | 129.9% of 2:00 W) |
Overall 2,000m 75th percentile (1:49.8 / 7:19.3) |
1:45.0 (0.210 s/m) |
302.3 W |
+39.3 W (+14.9% | 149.3% of 2:00 W) |
Sub-7:00 2,000m (7:00.0); Overall 500m median (1:45.9) |
1:40.0 (0.200 s/m) |
350.0 W |
+87.0 W (+33.1% | 172.8% of 2:00 W) |
Men Hwt 2,000m 90th percentile (1:40.9 / 6:43.6) |
1:35.0 (0.190 s/m) |
408.2 W |
+58.2 W (+16.6% | 201.6% of 2:00 W) |
Elite Men Hwt 2,000m (6:20.0) & 500m 75th (1:36.3) |
1:30.0 (0.180 s/m) |
480.1 W |
+130.1 W (+37.2% | 237.1% of 2:00 W) |
Sub-6:00 2,000m world-class / 500m 90th (1:28.9) |
1:20.0 (0.160 s/m) |
683.6 W |
+203.5 W (+42.4% | 337.5% of 2:00 W) |
Elite Heavyweight 500m anaerobic sprint |
Paul’s Law: How a 2k Erg Split Calculator Scales Pace Across 8 Distances
As exercise duration extends from anaerobic glycolysis (90 s for 500m) through maximal aerobic uptake (VO₂max, 6–8 min for 2,000m) to lactate-threshold and aerobic-endurance domains (20–210 min for 5,000m to 42,195m), sustainable mechanical power decays logarithmically. Rowers and coaches model this decay with Paul’s Law, the mathematical engine inside a 2k erg split calculator:
Split_2 = Split_1 + k × log₂(D_2 / D_1)

Split_D = Split_2000m + k × (ln(D / 2000) / ln(2))
Here, D_1 and D_2 are reference and target distances in meters, Split_1 and Split_2 are average /500m splits in seconds, and k is the physiological fatigue slope in seconds per 500m per distance doubling:
- Standard Balanced Rower (
k = 5.0 s / 500mper doubling): Every time race distance doubles (500m -> 1,000m -> 2,000m -> 4,000m), sustainable/500mpace slows by+5.0 seconds(and halving distance speeds pace up by-5.0 seconds). - Endurance / Lightweight Rower (
k = 4.0 to 4.5 s / 500mper doubling): High-threshold athletes with strong mitochondrial density lose only4.0–4.5 sper doubling from2,000mup to21,097m. - Sprint-Biased / High-Fast-Twitch or Novice Rower (
k = 5.5 to 6.5 s / 500mper doubling): Athletes with high peak sprint wattage (500m) but limited aerobic base slow by5.5–6.5 sper doubling. - Riegel Power-Law Cross-Check: Peter Riegel’s endurance equation (
Time_2 = Time_1 × (D_2 / D_1)^1.06, orSplit_2 = Split_1 × (D_2 / D_1)^0.06) adds+4.25%per distance doubling—which equals+5.10 secondsat a2:00.0(120 s) baseline, closely matching Paul’s Law across500mto42,195m.
Complete 8-Distance 2k Erg Split Calculator Matrix (500m to 42,195m)
Use this matrix as a direct 2k erg split calculator from a known 2,000m benchmark (1:45.0, 2:00.0, or 2:15.0 /500m), or add the Δ Split column to your personal 2k split:
Event Distance (log₂(D/2k)) |
Δ Split (k = 5.0s | 4.0s / 6.0s) |
% 2k Watts & Rate |
Projected Split & Time (1:45 | 2:00 | 2:15 2k) |
|---|---|---|---|
500m Sprint (-2.00) |
-10.0 s (-8.0s / -12.0s) |
129.9% W (36–44+ spm) |
1:35.0 (1:35.0) | 1:50.0 (1:50.0) | 2:05.0 (2:05.0) |
1,000m (1k) (-1.00) |
-5.0 s (-4.0s / -6.0s) |
113.6% W (32–36 spm) |
1:40.0 (3:20.0) | 1:55.0 (3:50.0) | 2:10.0 (4:20.0) |
2,000m (2k Base) (0.00) |
+0.0 s (+0.0s / +0.0s) |
100.0% W (28–34 spm) |
1:45.0 (7:00.0) | 2:00.0 (8:00.0) | 2:15.0 (9:00.0) |
5,000m (5k) (+1.32) |
+6.6 s (+5.3s / +7.9s) |
85.1% W (24–27 spm) |
1:51.6 (18:36.0) | 2:06.6 (21:06.0) | 2:21.6 (23:36.0) |
6,000m (6k) (+1.58) |
+7.9 s (+6.3s / +9.5s) |
82.6% W (24–26 spm) |
1:52.9 (22:34.8) | 2:07.9 (25:34.8) | 2:22.9 (28:34.8) |
10,000m (10k) (+2.32) |
+11.6 s (+9.3s / +13.9s) |
75.8% W (20–24 spm) |
1:56.6 (38:52.0) | 2:11.6 (43:52.0) | 2:26.6 (48:52.0) |
Half Marathon (21,097m) (+3.40) |
+17.0 s (+13.6s / +20.4s) |
67.2% W (18–22 spm) |
2:02.0 (1:25:47.7) | 2:17.0 (1:36:20.6) | 2:32.0 (1:46:53.5) |
Full Marathon (42,195m) (+4.40) |
+22.0 s (+17.6s / +26.4s) |
60.3% W (18–20 spm) |
2:07.0 (2:58:37.5) | 2:22.0 (3:19:43.4) | 2:37.0 (3:40:49.2) |
Starting from the actual 2026 Concept2 2,000m overall median split of 1:58.7 /500m, Paul’s Law (k = 5.0 s) predicts 2:05.3 for 5,000m (actual 2026 median: 2:06.6), 2:06.6 for 6,000m (actual: 2:07.5), 2:10.3 for 10,000m (actual: 2:09.3), 2:15.7 for 21,097m (actual: 2:14.4), and 2:20.7 for 42,195m (actual: 2:21.0)—tracking real-world Concept2 medians within 0.3 to 1.3 seconds/500m across a 21-fold distance range.
Worked Example: Calibrating Personal Slope (k) from 2,000m and 5,000m Tests
Suppose a rower logs a 2,000m test in 7:20.0 (Split_1 = 1:50.0 = 110.0 s, 263.0 W) and a 5,000m test in 19:25.0 (Split_2 = 1:56.5 = 116.5 s, 221.3 W). Solve for their personal fatigue constant k_personal:
k_personal = (Split_5000m - Split_2000m) / log₂(5000 / 2000) = (116.5 - 110.0) / 1.3219 = 4.92 s/doublingUsing k_personal = 4.92 s and Concept2’s Pace Calculator (Time = Split × Distance / 500), their projected 6,000m head-race target is 110.0 + (4.92 × 1.5850) = 117.8 s = 1:57.8 /500m (23:33.6 total, 214.0 W), and their 21,097m Half Marathon target is 110.0 + (4.92 × 3.3989) = 126.7 s = 2:06.7 /500m (1:29:06.0 total, 172.1 W).
Takeaway: Convert splits to watts with Watts = 2.80 / (Split_sec / 500)³ to account for the cubic power wall, and scale your 2,000m split across distances using Split_2 = Split_1 + k × log₂(D_2 / D_1).
2. What Is a Good Rowing Pace per 500m? 2026 Concept2 Benchmarks by Distance, Weight Class, Sex, and Age
Evaluating a good rowing pace per 500m requires separating results by sex and weight class. On water, extra body mass pushes a shell deeper and increases hull drag; on a static Concept2 RowErg, there is no water-displacement penalty. Taller, heavier rowers use longer lever arms and larger lean muscle mass to produce higher absolute watts (Watts = 2.80 / pace³).
Under Concept2’s Individual Record Requirements (with official lightweight records requiring a scale weigh-in within 2 hours before the row; see how to verify a Concept2 rowing result), weight classes are:
- Men’s Heavyweight (
Hwt):> 165.0 lbs(> 75.0 kg) | Men’s Lightweight (Lwt):<= 165.0 lbs(<= 75.0 kg). - Women’s Heavyweight (
Hwt):> 135.0 lbs(> 61.5 kg) | Women’s Lightweight (Lwt):<= 135.0 lbs(<= 61.5 kg).
Across Concept2’s 2026 rankings, Heavyweight medians are 2.7 to 5.4 seconds per 500m faster than Lightweight medians of the same sex (+14% to +22% mechanical wattage).
All-Rower 2026 Season Percentile Benchmarks Across All 8 Distances (500m to 42,195m)
The table below lists the 2026 Season (May 1, 2025 – April 30, 2026) overall percentiles across all eight distances from the Concept2 Online Logbook (all sexes and weights combined, non-adaptive):
| Event Distance | 90th & 75th Percentiles |
50th Median Split & Time |
25th Percentile & Median Watts |
|---|---|---|---|
500m Sprint |
1:28.9 (1:28.9) | 1:36.3 (1:36.3) |
1:45.9 (1:45.9) |
1:58.8 (1:58.8) | 294.7 W med |
1,000m (1k) |
1:38.4 (3:16.8) | 1:45.8 (3:31.7) |
1:56.1 (3:52.2) |
2:10.9 (4:21.9) | 223.6 W med |
2,000m (2k) |
1:42.7 (6:50.8) | 1:49.8 (7:19.3) |
1:58.7 (7:55.0) |
2:12.2 (8:48.8) | 209.2 W med |
5,000m (5k) |
1:51.8 (18:38.8) | 1:57.9 (19:39.7) |
2:06.6 (21:06.3) |
2:17.8 (22:58.9) | 172.5 W med |
6,000m (6k) |
1:50.9 (22:11.4) | 1:58.2 (23:39.5) |
2:07.5 (25:30.8) |
2:19.7 (27:56.4) | 168.9 W med |
10,000m (10k) |
1:55.7 (38:35.4) | 2:01.0 (40:21.8) |
2:09.3 (43:06.3) |
2:19.3 (46:26.0) | 161.9 W med |
Half Marathon (21,097m) |
1:58.9 (1:23:40.8) | 2:05.6 (1:28:23.0) |
2:14.4 (1:34:31.2) |
2:26.1 (1:42:46.8) | 144.2 W med |
Full Marathon (42,195m) |
2:01.9 (2:51:35.4) | 2:09.9 (3:02:49.3) |
2:21.0 (3:18:20.5) |
2:34.1 (3:36:51.4) | 124.9 W med |
Selection Bias Note (
6,000mvs5,000m): Because6,000mis the standard collegiate and national-team autumn head-race test while5,000mattracts a broader fitness cohort, the6,000m90th-percentile split (1:50.9) is0.9 s/500mfaster than the5,000m90th percentile (1:51.8), even though the 50th-percentile medians follow Paul’s Law (2:06.6vs2:07.5).
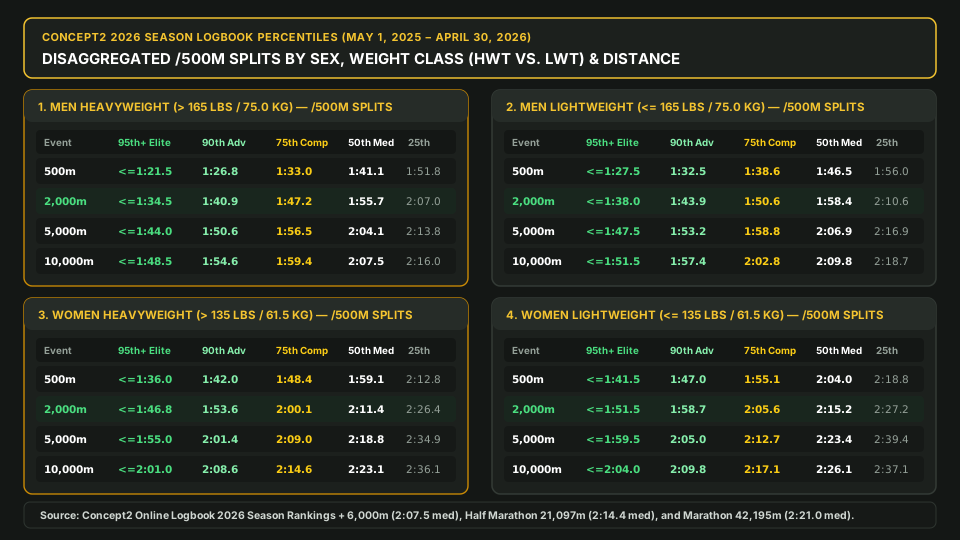
Disaggregated Weight-Class & Sex Benchmarks (500m, 2,000m, 5,000m, and 10,000m)
Compare your result directly against your sex and weight division (Men Hwt >165 lbs, Men Lwt <=165 lbs, Women Hwt >135 lbs, or Women Lwt <=135 lbs) in Concept2’s 2026 Season rankings:
| Distance & Weight Division | 95th+ Elite & 90th Advanced |
75th Competitive |
50th Median & 25th Developing |
|---|---|---|---|
500m — Men Hwt (> 165 lbs) |
<= 1:21.5 | 1:26.8 (1:26.8) |
1:33.0 (1:33.0) |
1:41.1 (1:41.1) | 1:51.8 (25th) |
500m — Men Lwt (<= 165 lbs) |
<= 1:27.5 | 1:32.5 (1:32.5) |
1:38.6 (1:38.6) |
1:46.5 (1:46.5) | 1:56.0 (25th) |
500m — Women Hwt (> 135 lbs) |
<= 1:36.0 | 1:42.0 (1:42.0) |
1:48.4 (1:48.4) |
1:59.1 (1:59.1) | 2:12.8 (25th) |
500m — Women Lwt (<= 135 lbs) |
<= 1:41.5 | 1:47.0 (1:47.0) |
1:55.1 (1:55.1) |
2:04.0 (2:04.0) | 2:18.8 (25th) |
2,000m — Men Hwt (> 165 lbs) |
<= 1:34.5 | 1:40.9 (6:43.6) |
1:47.2 (7:08.9) |
1:55.7 (7:42.8) | 2:07.0 (8:28.3) |
2,000m — Men Lwt (<= 165 lbs) |
<= 1:38.0 | 1:43.9 (6:55.9) |
1:50.6 (7:22.6) |
1:58.4 (7:53.7) | 2:10.6 (8:42.7) |
2,000m — Women Hwt (> 135 lbs) |
<= 1:46.8 | 1:53.6 (7:34.6) |
2:00.1 (8:00.7) |
2:11.4 (8:45.6) | 2:26.4 (9:45.7) |
2,000m — Women Lwt (<= 135 lbs) |
<= 1:51.5 | 1:58.7 (7:54.8) |
2:05.6 (8:22.7) |
2:15.2 (9:00.9) | 2:27.2 (9:48.9) |
5,000m — Men Hwt (> 165 lbs) |
<= 1:44.0 | 1:50.6 (18:26.7) |
1:56.5 (19:25.3) |
2:04.1 (20:41.1) | 2:13.8 (22:18.9) |
5,000m — Men Lwt (<= 165 lbs) |
<= 1:47.5 | 1:53.2 (18:52.8) |
1:58.8 (19:48.4) |
2:06.9 (21:09.1) | 2:16.9 (22:49.4) |
5,000m — Women Hwt (> 135 lbs) |
<= 1:55.0 | 2:01.4 (20:14.2) |
2:09.0 (21:30.1) |
2:18.8 (23:08.9) | 2:34.9 (25:49.3) |
5,000m — Women Lwt (<= 135 lbs) |
<= 1:59.5 | 2:05.0 (20:50.0) |
2:12.7 (22:07.4) |
2:23.4 (23:54.0) | 2:39.4 (26:34.9) |
10,000m — Men Hwt (> 165 lbs) |
<= 1:48.5 | 1:54.6 (38:12.2) |
1:59.4 (39:49.5) |
2:07.5 (42:30.5) | 2:16.0 (45:21.0) |
10,000m — Men Lwt (<= 165 lbs) |
<= 1:51.5 | 1:57.4 (39:08.5) |
2:02.8 (40:56.9) |
2:09.8 (43:16.0) | 2:18.7 (46:15.5) |
10,000m — Women Hwt (> 135 lbs) |
<= 2:01.0 | 2:08.6 (42:53.8) |
2:14.6 (44:53.3) |
2:23.1 (47:43.3) | 2:36.1 (52:03.4) |
10,000m — Women Lwt (<= 135 lbs) |
<= 2:04.0 | 2:09.8 (43:17.4) |
2:17.1 (45:43.1) |
2:26.1 (48:43.9) | 2:37.1 (52:23.7) |
How weight class shifts classic milestones:
- Sub-7:00
2,000m(1:45.0 /500m,302.3 W): Between the75th(1:47.2) and90th(1:40.9) percentiles for Heavyweight Men, within1.1 sof the90th percentile(1:43.9) for Lightweight Men, and inside the95th+national-trial tier (<= 1:46.8) for Heavyweight Women. - Sub-8:00
2,000m(2:00.0 /500m,202.5 W): Just below the50thmedian for Men (1:55.7Hwt /1:58.4Lwt), right at the75th percentile(2:00.1) for Heavyweight Women, and near the90th percentile(1:58.7) for Lightweight Women.
Age-Group Adjustments: 2,000m Splits from 19–29 Through Masters 60–64
Because VO₂max declines by ~0.7%–1.0% per year after age 30 (~1.5–3.5 s/500m per decade), compare your 2,000m split against your age bracket in Concept2’s 2026 Season rankings, then add Paul’s Law deltas (+6.6 s for 5k, +11.6 s for 10k) for longer distances:
Age Bracket (2,000m) |
Men 75th & 50th Median (/500m & Time) |
Women 75th & 50th Median (/500m & Time) |
25th Developing (Men | Women) |
|---|---|---|---|
19–29 |
1:39.0 (6:36.3) | 1:44.4 (6:57.8) |
1:54.3 (7:37.4) | 2:00.4 (8:01.7) |
1:52.4 (7:29.9) | 2:09.7 (8:39.1) |
30–39 |
1:44.1 (6:56.7) | 1:51.1 (7:24.6) |
1:57.9 (7:51.8) | 2:06.9 (8:27.9) |
1:59.7 (7:58.9) | 2:21.5 (9:26.3) |
40–49 |
1:47.3 (7:09.5) | 1:54.5 (7:38.2) |
2:00.4 (8:01.9) | 2:09.5 (8:38.0) |
2:02.8 (8:11.5) | 2:22.0 (9:28.0) |
50–54 (50–59 Ref) |
1:49.3 (7:17.4) | 1:55.9 (7:43.7) |
2:02.2 (8:08.8) | 2:14.0 (8:56.2) |
2:04.3 (8:17.5) | 2:24.7 (9:38.9) |
60–64 (60–69 Ref) |
1:54.0 (7:36.2) | 2:01.1 (8:04.7) |
2:10.2 (8:40.8) | 2:18.7 (9:14.9) |
2:12.6 (8:50.6) | 2:34.7 (10:19.0) |
Takeaway: Benchmark your split strictly within your own distance, sex, weight class (Hwt vs Lwt), and age bracket.
3. Flywheel Drag Factor Physics (110–135), Stroke Rate Ceilings, and Avoiding the “Fly-and-Die” Lactate Spike
Flywheel Deceleration Physics: Why Damper Setting (1–10) Is Not Resistance
As explained in Concept2’s Damper Setting and Drag Factor guide, the side damper lever (1–10) is only a plastic air vent controlling airflow into the flywheel cage. Altitude, air temperature, barometric pressure, and dust trapped in the perforated mesh alter air resistance—so Damper 5 on a dusty gym erg can read 100, while Damper 5 on a clean sea-level RowErg reads 132 (new RowErg range: <= 90 at Damper 1 to >= 200 at Damper 10).
During the recovery phase of every stroke, the clutch disengages and the PM5 measures the flywheel’s true angular deceleration (dω / dt) to compute Drag Factor (k):
τ_drag = I × (dω / dt) = -k × ω² --> k = -I × (dω / dt) / ω² [in units of 10⁻⁶ N·m·s²]Where I ≈ 0.1001 kg·m² is the flywheel rotational inertia. Because the PM5 uses this measured k to calculate work on the next drive, setting the damper to 10 never grants “bonus meters”—it only increases catch torque and lumbar shear.
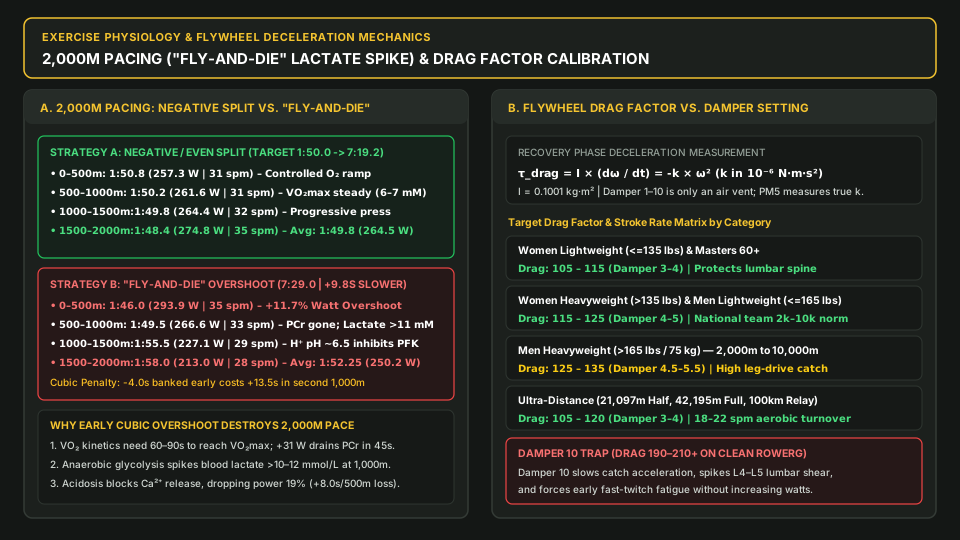
Target Drag Factor & Stroke-Rate Calibration Matrix
Before any test or relay shift, open PM5 Main Menu > More Options > Display Drag Factor and adjust the damper lever to match your division:
| Athlete or Event Category | Target Drag Factor (10⁻⁶ N·m·s²) & Damper |
Target Stroke Rate (spm) |
Biomechanical Rationale |
|---|---|---|---|
Women Lwt (<= 135 lbs), Youth & Masters 60+ |
105 – 115 (Damper 3.0 – 4.0) |
2k: 30–34 | 5k–10k: 22–26 |
Preserves fast drive speed (~0.75 s) and the 2:1 recovery-to-drive ratio (see indoor rowing form guide) without lumbar overload. |
Women Hwt (> 135 lbs) & Men Lwt (<= 165 lbs) |
115 – 125 (Damper 4.0 – 5.0) |
2k: 30–34 | 5k–10k: 22–27 |
Matches on-water boat feel and national-team testing norms (115–125) from 2,000m to 10,000m. |
Men Heavyweight (> 165 lbs) — 2k to 10k |
125 – 135 (Damper 4.5 – 5.5) |
2k: 28–34 | 5k–10k: 20–26 |
Supports high-force leg drive engagement (300–450+ W) without premature fast-twitch fatigue. |
Ultra-Distance (21,097m, 42,195m, 100km Relay) |
105 – 120 (Damper 3.0 – 4.2) |
18 – 22 spm (20–24 relay) |
Reduces peak catch loading across 2,500–10,500+ strokes, favoring oxidative Type I muscle fibers. |
Short Anaerobic Sprints (100m – 500m Only) |
135 – 150+ (Damper 6.0 – 8.0+) |
36 – 46+ spm |
Prevents flywheel spin-out at 40+ spm; unsuitable for >= 1,000m due to lumbar shear and early lockup. |
The Exercise Physiology of “Fly-and-Die” Pacing Failure on 2,000m Tests
Opening the first 500m of a 2,000m test 3 to 5 seconds/500m faster than target pace triggers a “Fly-and-Die” collapse through four mechanisms:
- Cubic Wattage Overshoot (
+11.7%to+15.8%Power): On a1:50.0 /500m(263.0 W) target2k, pulling1:46.0(-4.0 s) in the first500mdemands293.9 W(+30.9 Wor+11.7%extra power). VO₂Lag & Phosphocreatine (PCr) Depletion (0–90 s): A2,000mrow is~75%–82%aerobic, but oxygen uptake (VO₂) takes60 to 90 secondsto reachVO₂max. Over-rowing the first500mdrains intramuscularPCrwithin45 secondsand forces heavy anaerobic glycolysis.- Blood Lactate (
> 10–12 mmol/L) &H⁺Acidosis at1,000m: Glycolysis floods muscle fibers with lactate and hydrogen ions (H⁺), dropping intracellularpHfrom~7.1to6.5–6.6, inhibiting phosphofructokinase (PFK), and impairing sarcoplasmicCa²⁺release. - Asymmetric Cubic Time Penalty (
-4.0 sGained vs+13.5 sLost): When acidosis forces power down14%–19%in the second1,000m(263 W -> 227 W -> 213 W), the split balloons to1:55.5and1:58.0, costing+9.8 secondsnet time.
500m Segment |
Strategy A: Negative / Even Split (Target 1:50.0) |
Strategy B: “Fly-and-Die” Failure (-4.0s Start) |
Segment Delta (B vs A) |
|---|---|---|---|
0m – 500m |
1:50.8 (257.3 W | 31 spm) — Settle +0.8s calm during O₂ ramp |
1:46.0 (293.9 W | 35 spm) — +11.7% watt overshoot drains PCr |
B is -4.8 s ahead; burns +36.6 W excess |
500m – 1,000m |
1:50.2 (261.6 W | 31 spm) — VO₂max steady; lactate ~6.5 mmol/L |
1:49.5 (266.6 W | 33 spm) — PCr depleted; lactate > 11 mmol/L |
B leads by -5.5 s at 1,000m; severe acidosis |
1,000m – 1,500m |
1:49.8 (264.4 W | 32 spm) — Controlled press; fresh motor units |
1:55.5 (227.1 W | 29 spm) — pH ~6.5 forces -14.8% watt drop |
B loses +5.7 s in 3rd 500m; loses lead |
1,500m – 2,000m |
1:48.4 (274.8 W | 35 spm) — Anaerobic kick over last 350m |
1:58.0 (213.0 W | 28 spm) — Muscular tie-up; -50.0 W below goal |
B loses +9.6 s in final 500m |
Total 2,000m |
7:19.2 (1:49.8 avg | 264.5 W mean | Beats 7:20 by -0.8 s) |
7:29.0 (1:52.25 avg | 250.2 W mean | Misses goal by +9.0 s) |
Strategy B is +9.8 s slower (-14.3 W mean) |
For long challenges—see endurance challenges: team relay handoffs and solo pacing and how to organize a charity challenge event—pace solo marathons (42,195m) at 2k + 22.0 s (105–120 drag, 18–20 spm), and pace 20-minute team relay shifts at 5,000m threshold (2k + 6.6 s to +8.5 s) plus a +2.0 to +3.5 s/500m multi-shift fatigue buffer. Beginners should build their base split using the 4-week beginner rowing workout plan.
Takeaway: Calibrate Drag Factor (105–135) on the PM5 screen, hold your first 500m within +0.5 to +0.8 s of target pace while VO₂ ramps up, and negative-split the second half.
4. Five Common Rowing Pace & Split Calculation Failure Modes
| Failure Mode | Root Cause | Consequence | Preventive Control |
|---|---|---|---|
1. “Fly-and-Die” First-500m Overshoot (-3 to -5 s) |
Pulling 1:46 on a 1:50 target 2k before VO₂max ramps up (60–90 s). |
+11.7% watt spike drains PCr, spikes blood lactate > 10–12 mmol/L, and costs +8 to +15 s net time. |
Settle +0.5 to +0.8 s/500m slower than target pace through 750m, then negative-split. |
2. Linear Split Target Setting (Watts = 2.80 / pace³) |
Assuming 1:45 -> 1:40 requires the same watt jump as 2:05 -> 2:00. |
2:05 -> 2:00 costs +23.3 W, whereas 1:45 -> 1:40 costs +47.7 W (2.05x more power). |
Convert goal splits into Watts via the Concept2 Watts Calculator and progress by +3%–5% W. |
| 3. Comparing Lightweight/Female Rows to Open Tables | Benchmarking a <= 165 lb man or <= 135 lb woman against heavyweight men. |
Static ergs reward absolute watts (W), misclassifying 75th-percentile lightweight rows as below median. |
Filter Concept2 rankings by Sex, Weight Class (Hwt vs Lwt), and Age Bracket. |
4. Damper 10 Trap (Drag Factor >= 190–210) |
Mistaking the 1–10 air vent for a resistance multiplier that yields faster splits. |
Excessive catch torque slows drive velocity, overloads L4–L5 lumbar discs, and causes early muscular lockup. |
Set PM5 > More Options > Display Drag Factor to 105–135 (Damper 3–5). |
5. Unscaled 2,000m Pace on 5k–42.2k (k = 0) |
Projecting 5,000m, 10,000m, or relay shift times directly from a 2,000m split. |
Overestimates sustainable pace by 6.6 to 22.0 s/500m, causing solo blow-ups or missed relay schedules. |
Apply Paul’s Law (Split_2 = Split_1 + k × log₂(D_2 / D_1)) plus relay handoff allowances. |
Takeaway: Audit every goal split against the PM5 cubic wattage formula, Paul’s Law distance scaling, your weight-class percentile table, and a verified 105–135 Drag Factor.
Method and sources
All percentile benchmarks were verified on October 26, 2026 from the Concept2 Online Logbook 2026 Season RowErg Rankings (May 1, 2025 – April 30, 2026) across 500m, 1,000m, 2,000m, 5,000m, 6,000m, 10,000m, 21,097m, and 42,195m using official sex, age, and weight-class filters (Men Hwt > 165 lbs / 75.0 kg, Men Lwt <= 165 lbs, Women Hwt > 135 lbs / 61.5 kg, Women Lwt <= 135 lbs per Concept2 Individual Record Requirements). Power and pace formulas follow the Concept2 Watts Calculator and Pace Calculator; flywheel deceleration and stroke-rate bands summarize All About Damper Setting and Drag Factor and Rowing Stroke Rate Explained. See the About page for site scope.
Related reading
Explore these companion guides in Indoor Rowing and Endurance Challenges on the Challenge Blog:
- What Is a Good Rowing Pace per 500m? Percentile Chart and Conversion Formulas — Linear time-to-distance conversion tables and
100,000mto1,000,000mteam relay shift planning charts. - Indoor Rowing Form: Catch, Drive, Finish and Recovery — The legs-back-arms drive sequence and
2:1recovery-to-drive timing ratio needed to hold target splits. - Rowing Machine Workouts for Beginners: A 4-Week Plan and How Long to Row — Concept2’s 4-week From Couch to Consistency plan for establishing your first steady split.
- Endurance Challenges: Team Relay Handoffs and Solo Pacing — Budgeting changeover clock allowances and separating solo pacing from continuous team relays.
- Verify a Concept2 Rowing Result: Logbook, Rankings and Relay Evidence — 16-digit PM5 verification codes, lightweight 2-hour weigh-in rules, and witness logs.
- How to Organize a Charity Event: A 12-Week Plan for Endurance Challenges — Turning steady splits into 20-minute team relay shift rotas and schedules.